・21 min read
【Jetson nano】ラジコン自動運転開発日記(10)~OpenCVレーン検知してみた~
【Jetson nano】ラジコン自動運転開発日記(10)~OpenCVレーン検知してみた~

Environement:
- jetson nano
- Docker (L4t-ml)
- Python 3.6
パッケージのインストール
基本的にはL4t-mlに同梱されているのでアップグレードする感じです.
!pip3 install --user -U pip
!pip3 install -U Pillow
Collecting pip
Downloading https://files.pythonhosted.org/packages/a4/6d/6463d49a933f547439d6b5b98b46af8742cc03ae83543e4d7688c2420f8b/pip-21.3.1-py3-none-any.whl (1.7MB)
[K 100% |################################| 1.7MB 298kB/s eta 0:00:01
[?25hInstalling collected packages: pip
Successfully installed pip-21.3.1
WARNING: pip is being invoked by an old script wrapper. This will fail in a future version of pip.
Please see https://github.com/pypa/pip/issues/5599 for advice on fixing the underlying issue.
To avoid this problem you can invoke Python with '-m pip' instead of running pip directly.
Requirement already satisfied: Pillow in /usr/local/lib/python3.6/dist-packages/Pillow-8.0.1-py3.6-linux-aarch64.egg (8.0.1)
Collecting Pillow
Downloading Pillow-8.4.0-cp36-cp36m-manylinux_2_17_aarch64.manylinux2014_aarch64.whl (3.0 MB)
|################################| 3.0 MB 7.0 MB/s
[?25hInstalling collected packages: Pillow
Attempting uninstall: Pillow
Found existing installation: Pillow 8.0.1
Uninstalling Pillow-8.0.1:
Successfully uninstalled Pillow-8.0.1
Successfully installed Pillow-8.4.0
[33mWARNING: Running pip as the 'root' user can result in broken permissions and conflicting behaviour with the system package manager. It is recommended to use a virtual environment instead: https://pip.pypa.io/warnings/venv[0m
テスト画像の読み込み
#Importing some useful packages
import matplotlib.pyplot as plt
import matplotlib.image as mpimg
import numpy as np
import cv2
import os
import glob
#from moviepy.editor import VideoFileClip

%matplotlib inline
def list_images(images, cols = 2, rows = 5, cmap=None):
"""
Display a list of images in a single figure with matplotlib.
Parameters:
images: List of np.arrays compatible with plt.imshow.
cols (Default = 2): Number of columns in the figure.
rows (Default = 5): Number of rows in the figure.
cmap (Default = None): Used to display gray images.
"""
plt.figure(figsize=(10, 11))
for i, image in enumerate(images):
plt.subplot(rows, cols, i+1)
#Use gray scale color map if there is only one channel
cmap = 'gray' if len(image.shape) == 2 else cmap
plt.imshow(image, cmap = cmap)
plt.xticks([])
plt.yticks([])
plt.tight_layout(pad=0, h_pad=0, w_pad=0)
plt.show()# Reading in the test images
test_images = [cv2.cvtColor(cv2.imread(img), cv2.COLOR_BGR2RGB) for img in glob.glob('test_images_png/*.png')]
test_images_path = glob.glob('test_images_png/*.png')
print(test_images_path)
list_images(test_images)['test_images_png/02.solidWhiteRight.png', 'test_images_png/01.solidWhiteCurve.png']

<matplotlib.figure.Figure at 0x7f724ba5c0>
!ls'=0.2.3' h2wy1zy-300x169.jpg sample2.png
LICENSE image-1660040058221-300x169.png test_images
Lane-Lines-Detection.ipynb input_example.jpg test_images_png
README.md output_example.jpg test_videos
Writeup.md output_videos
_config.yml output_videos2
色の選択
テスト画像の車線は,白と黄色の2色です.このため,車線を強調できるような色空間を選択します.
Original RGB color selection
元のRGBフォーマットの
test_imagesに色選択を適用してみます.車線の線をできるだけ残しながら,その他のものはほとんど黒くしていきます.def RGB_color_selection(image):
"""
Apply color selection to RGB images to blackout everything except for white and yellow lane lines.
Parameters:
image: An np.array compatible with plt.imshow.
"""
#White color mask
lower_threshold = np.array([200, 200, 200])
upper_threshold = np.array([255, 255, 255])
print(lower_threshold)
print(upper_threshold)
print(image.shape)
white_mask = cv2.inRange(image, lower_threshold, upper_threshold)
#Yellow color mask
lower_threshold = np.array([175, 175, 0])
upper_threshold = np.array([255, 255, 255])
yellow_mask = cv2.inRange(image, lower_threshold, upper_threshold)
#Combine white and yellow masks
mask = cv2.bitwise_or(white_mask, yellow_mask)
masked_image = cv2.bitwise_and(image, image, mask = mask)
# ---------------------------------
# visual
#
plt.figure(figsize=(10, 11))
plt.imshow(white_mask)
plt.figure(figsize=(10, 11))
plt.imshow(yellow_mask)
plt.figure(figsize=(10, 11))
plt.imshow(masked_image)
return masked_imagefor image in test_images:
RGB_color_selection(image)[200 200 200]
[255 255 255]
(540, 960, 3)
[200 200 200]
[255 255 255]
(540, 960, 3)

<matplotlib.figure.Figure at 0x7f7231d630>

<matplotlib.figure.Figure at 0x7f722ea3c8>

<matplotlib.figure.Figure at 0x7f722a0cf8>

<matplotlib.figure.Figure at 0x7f72261748>

<matplotlib.figure.Figure at 0x7f722f55f8>

<matplotlib.figure.Figure at 0x7f721d3b70>
RGB色空間の
test_imagesに色選択を適用した結果です.a) HSV color space
HSVは,RGBカラーモデルの代替表現である.HSV表現は色の混ざり方をモデル化したもので,彩度の次元は明るい色の絵の具の様々な色合いに似ており,値の次元はそれらの絵の具に様々な量の黒や白を混ぜたものに似ています.
def convert_hsv(image):
    """
    Convert RGB images to HSV.
        Parameters:
            image: An np.array compatible with plt.imshow.
    """

    #return cv2.cvtColor(image, cv2.COLOR_RGB2HSV)
    return cv2.cvtColor(image, cv2.COLOR_RGB2HSV)

list_images(list(map(convert_hsv, test_images)))
<matplotlib.figure.Figure at 0x7f7227c940>
def HSV_color_selection(image):
    """
    Apply color selection to the HSV images to blackout everything except for white and yellow lane lines.
        Parameters:
            image: An np.array compatible with plt.imshow.
    """
    #Convert the input image to HSV
    converted_image = convert_hsv(image)

    #White color mask
    lower_threshold = np.array([0, 0, 210])
    upper_threshold = np.array([255, 30, 255])
    white_mask = cv2.inRange(converted_image, lower_threshold, upper_threshold)

    #Yellow color mask
    lower_threshold = np.array([18, 80, 80])
    upper_threshold = np.array([30, 255, 255])
    yellow_mask = cv2.inRange(converted_image, lower_threshold, upper_threshold)

    #Combine white and yellow masks
    mask = cv2.bitwise_or(white_mask, yellow_mask)
    masked_image = cv2.bitwise_and(image, image, mask = mask)

return masked_imagelist_images(list(map(HSV_color_selection, test_images)))
<matplotlib.figure.Figure at 0x7f71e8c588>
c) HSL color space
HSLは,RGBカラーモデルの代替表現である.HSLモデルは,NCSやマンセルなど,より知覚的な色モデルに近づこうとするもので,明度値1/2の円の周りに完全飽和色を配置し,明度値0または1はそれぞれ完全な黒または白を意味する.
def convert_hsl(image):
    """
    Convert RGB images to HSL.
        Parameters:
            image: An np.array compatible with plt.imshow.
    """
    return cv2.cvtColor(image, cv2.COLOR_RGB2HLS)

list_images(list(map(convert_hsl, test_images)))
<matplotlib.figure.Figure at 0x7f71e0af98>
def HSL_color_selection(image):
    """
    Apply color selection to the HSL images to blackout everything except for white and yellow lane lines.
        Parameters:
            image: An np.array compatible with plt.imshow.
    """
    #Convert the input image to HSL
    converted_image = convert_hsl(image)

    #White color mask
    lower_threshold = np.uint8([0, 200, 0])
    upper_threshold = np.uint8([255, 255, 255])
    white_mask = cv2.inRange(converted_image, lower_threshold, upper_threshold)

    #Yellow color mask
    lower_threshold = np.uint8([10, 0, 100])
    upper_threshold = np.uint8([40, 255, 255])
    yellow_mask = cv2.inRange(converted_image, lower_threshold, upper_threshold)

    #Combine white and yellow masks
    mask = cv2.bitwise_or(white_mask, yellow_mask)
    masked_image = cv2.bitwise_and(image, image, mask = mask)

return masked_imagelist_images(list(map(HSL_color_selection, test_images)))
<matplotlib.figure.Figure at 0x7f704de198>
color_selected_images = list(map(HSL_color_selection, test_images))Canny Edge Detection
Cannyエッジ検出器は,多段階アルゴリズムを用いて画像中のさまざまなエッジを検出するエッジ検出演算子です.
a) Gray scaling the images
Cannyエッジ検出アルゴリズムは,各画素の強度勾配を測定する.そのため,エッジを検出するためには,画像をグレースケールに変換する必要があります.
def gray_scale(image):
    """
    Convert images to gray scale.
        Parameters:
            image: An np.array compatible with plt.imshow.
    """
    return cv2.cvtColor(image, cv2.COLOR_RGB2GRAY)
gray_images = list(map(gray_scale, color_selected_images))
list_images(gray_images)
<matplotlib.figure.Figure at 0x7f704ed668>
b) Applying Gaussian smoothing
すべてのエッジ検出結果は画像ノイズの影響を受けやすい.そこで,ノイズによる誤検出を防ぐために,ノイズをフィルタリングすることが不可欠である.画像を滑らかにするために,ガウシアンフィルターを適用して画像を畳み込みます.
このステップでは,エッジ検出器に対する明らかなノイズの影響を軽減するために,画像をわずかに平滑化します.
def gaussian_smoothing(image, kernel_size = 13):
    """
    Apply Gaussian filter to the input image.
        Parameters:
            image: An np.array compatible with plt.imshow.
            kernel_size (Default = 13): The size of the Gaussian kernel will affect the performance of the detector.
            It must be an odd number (3, 5, 7, ...).
    """
    return cv2.GaussianBlur(image, (kernel_size, kernel_size), 0)
blur_images = list(map(gaussian_smoothing, gray_images))
list_images(blur_images)
<matplotlib.figure.Figure at 0x7f72197b70>
c) Applying Canny Edge Detection
Cannyエッジ検出アルゴリズムのプロセスは,5つのステップに分けることができます.
- 画像の強度勾配を求める
- エッジ検出のためのスプリアス反応を取り除くために,非最大限の抑制を適用する.
- 二重しきい値を適用して,潜在的なエッジを決定する.
- ヒステリシスによりエッジを追跡する.エッジの検出は,弱いエッジや強いエッジに接続されていない他のエッジをすべて抑制することによって最終的に行われます.
*エッジピクセルの勾配値が高閾値より大きい場合,強いエッジピクセルとしてマークされます.
エッジピクセルのグラデーション値が高しきい値より小さく,低しきい値より大きい場合,弱いエッジピクセルとしてマークされます.エッジピクセルの値が低いしきい値よりも小さい場合,それは抑制されます.
2つの閾値は経験的に決定され,その定義は入力画像の内容に依存します.
def canny_detector(image, low_threshold = 50, high_threshold = 150):
    """
    Apply Canny Edge Detection algorithm to the input image.
        Parameters:
            image: An np.array compatible with plt.imshow.
            low_threshold (Default = 50).
            high_threshold (Default = 150).
    """
    return cv2.Canny(image, low_threshold, high_threshold)
edge_detected_images = list(map(canny_detector, blur_images))
list_images(edge_detected_images)
<matplotlib.figure.Figure at 0x7f71ef2e10>
領域抽出
レーンラインがある領域を抽出し,それ以外を切り出します.
def region_selection(image):
    """
    Determine and cut the region of interest in the input image.
        Parameters:
            image: An np.array compatible with plt.imshow.
    """
    mask = np.zeros_like(image)
    #Defining a 3 channel or 1 channel color to fill the mask with depending on the input image
    if len(image.shape) > 2:
        channel_count = image.shape[2]
        ignore_mask_color = (255,) * channel_count
    else:
        ignore_mask_color = 255
    #We could have used fixed numbers as the vertices of the polygon,
    #but they will not be applicable to images with different dimesnions.
    rows, cols = image.shape[:2]
    bottom_left  = [cols * 0.1, rows * 0.95]
    top_left     = [cols * 0.4, rows * 0.6]
    bottom_right = [cols * 0.9, rows * 0.95]
    top_right    = [cols * 0.6, rows * 0.6]
    vertices = np.array([[bottom_left, top_left, top_right, bottom_right]], dtype=np.int32)
    cv2.fillPoly(mask, vertices, ignore_mask_color)
    masked_image = cv2.bitwise_and(image, mask)
    return masked_image
masked_image = list(map(region_selection, edge_detected_images))
list_images(masked_image)
<matplotlib.figure.Figure at 0x7f9d6c0b38>
Hough変換
ハフ変換は,画像内の特定の形状の特徴を分離するために用いることができる手法であり,今回はselected_region_imagesで車線を検出するために使用する.
def hough_transform(image):
    """
    Determine and cut the region of interest in the input image.
        Parameters:
            image: The output of a Canny transform.
    """
    rho = 1              #Distance resolution of the accumulator in pixels.
    theta = np.pi/180    #Angle resolution of the accumulator in radians.
    threshold = 20       #Only lines that are greater than threshold will be returned.
    minLineLength = 20   #Line segments shorter than that are rejected.
    maxLineGap = 300     #Maximum allowed gap between points on the same line to link them
    return cv2.HoughLinesP(image, rho = rho, theta = theta, threshold = threshold,
                           minLineLength = minLineLength, maxLineGap = maxLineGap)
hough_lines には,選択領域で検出された線のリストが格納されます.この検出された線を元のtest_imagesに描画していきます.
hough_lines = list(map(hough_transform, masked_image))def draw_lines(image, lines, color = [255, 0, 0], thickness = 2):
"""
Draw lines onto the input image.
Parameters:
image: An np.array compatible with plt.imshow.
lines: The lines we want to draw.
color (Default = red): Line color.
thickness (Default = 2): Line thickness.
"""
image = np.copy(image)
for line in lines:
for x1,y1,x2,y2 in line:
cv2.line(image, (x1, y1), (x2, y2), color, thickness)
return imageline_images = []
for image, lines in zip(test_images, hough_lines):
line_images.append(draw_lines(image, lines))
list_images(line_images)
<matplotlib.figure.Figure at 0x7f71e8c630>
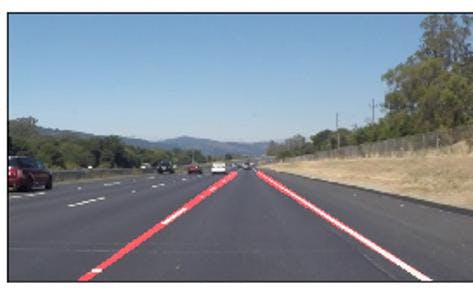
レーンラインの平均化
各車線ごとに複数のラインが検出されました.これらの線を平均化し,各レーンの線を一本化する必要があります.また,車線の全長をカバーするために,車線の線を外挿を描画します.
def average_slope_intercept(lines):
    """
    Find the slope and intercept of the left and right lanes of each image.
        Parameters:
            lines: The output lines from Hough Transform.
    """
    left_lines    = [] #(slope, intercept)
    left_weights  = [] #(length,)
    right_lines   = [] #(slope, intercept)
    right_weights = [] #(length,)

    for line in lines:
        for x1, y1, x2, y2 in line:
            if x1 == x2:
                continue
            slope = (y2 - y1) / (x2 - x1)
            intercept = y1 - (slope * x1)
            length = np.sqrt(((y2 - y1) ** 2) + ((x2 - x1) ** 2))
            if slope < 0:
                left_lines.append((slope, intercept))
                left_weights.append((length))
            else:
                right_lines.append((slope, intercept))
                right_weights.append((length))
    left_lane  = np.dot(left_weights,  left_lines) / np.sum(left_weights)  if len(left_weights) > 0 else None
    right_lane = np.dot(right_weights, right_lines) / np.sum(right_weights) if len(right_weights) > 0 else None
    return left_lane, right_lane
def pixel_points(y1, y2, line):
"""
Converts the slope and intercept of each line into pixel points.
Parameters:
y1: y-value of the line's starting point.
y2: y-value of the line's end point.
line: The slope and intercept of the line.
"""
if line is None:
return None
slope, intercept = line
x1 = int((y1 - intercept)/slope)
x2 = int((y2 - intercept)/slope)
y1 = int(y1)
y2 = int(y2)
return ((x1, y1), (x2, y2))def lane_lines(image, lines):
"""
Create full lenght lines from pixel points.
Parameters:
image: The input test image.
lines: The output lines from Hough Transform.
"""
left_lane, right_lane = average_slope_intercept(lines)
y1 = image.shape[0]
y2 = y1 * 0.6
left_line = pixel_points(y1, y2, left_lane)
right_line = pixel_points(y1, y2, right_lane)
return left_line, right_line
def draw_lane_lines(image, lines, color=[255, 0, 0], thickness=12):
"""
Draw lines onto the input image.
Parameters:
image: The input test image.
lines: The output lines from Hough Transform.
color (Default = red): Line color.
thickness (Default = 12): Line thickness.
"""
line_image = np.zeros_like(image)
for line in lines:
if line is not None:
cv2.line(line_image, *line, color, thickness)
return cv2.addWeighted(image, 1.0, line_image, 1.0, 0.0)
lane_images = []
for image, lines in zip(test_images, hough_lines):
lane_images.append(draw_lane_lines(image, lane_lines(image, lines)))
list_images(lane_images)
<matplotlib.figure.Figure at 0x7f71e119b0>
動画で処理してみる
#Import everything needed to edit/save/watch video clips
#from moviepy import *
from IPython.display import HTML
from IPython.display import Image

from io import BytesIO
import os
import io

import IPython
from PIL import Image
import cv2
import time
import numpy as np
def frame_processor(image):
"""
Process the input frame to detect lane lines.
Parameters:
image: Single video frame.
"""
color_select = HSL_color_selection(image)
gray = gray_scale(color_select)
smooth = gaussian_smoothing(gray)
edges = canny_detector(smooth)
region = region_selection(edges)
hough = hough_transform(region)
result = draw_lane_lines(image, lane_lines(image, hough))
return resultdef process_video(test_video, output_video):
"""
Read input video stream and produce a video file with detected lane lines.
Parameters:
test_video: Input video.
output_video: A video file with detected lane lines.
"""
cap = cv2.VideoCapture(test_video)
t_list = []
while 1:
ret, frame = cap.read()
if ret:
# print(frame.shape)
# (360, 640, 3)
frame = cv2.cvtColor(frame, cv2.COLOR_BGR2RGB)
time_start = time.perf_counter()
result = frame_processor(frame)
time_end = time.perf_counter()
show(result)
IPython.display.clear_output(wait=True)
# 経過時間(秒)
t = time_end- time_start
t_list.append(t)
#print("FPS : {}".format(1/t))
else:
break
t_ave = np.sum(np.array(t_list))/len(t_list)
print("t_ave :{}".format(t_ave))
print("fps_ave:{}".format(1/t_ave))def process_video2(test_video, output_video):
"""
Read input video stream and produce a video file with detected lane lines.
Parameters:
test_video: Input video.
output_video: A video file with detected lane lines.
"""
input_video = VideoFileClip(os.path.join('test_videos', test_video), audio=False)
processed = input_video.fl_image(frame_processor)
processed.write_videofile(os.path.join('output_videos', output_video), audio=False)# 画像をjpegバイナリに変換してIpythonで表示する
def show(a, fmt='jpeg'):
new_image = Image.fromarray(a)
output = io.BytesIO()
new_image.save(output, format='JPEG')
image_jpg = output.getvalue()
f = BytesIO()
Image.fromarray(a).save(f, fmt) # (3)
IPython.display.display(IPython.display.Image(data=f.getvalue())) # (4)%time process_video('test_videos/solidWhiteRight.mp4', 'output_videos2/solidWhiteRight_output.mp4')t_ave :0.03713114999572174
fps_ave:26.931565548473994
CPU times: user 30.2 s, sys: 1.45 s, total: 31.6 s
Wall time: 25.4 s
おわりに
今回は,jetson nanoでもサクサク動くようなOpenCVベースのレーン検知をやっていきました.
26FPSくらい出ており,まずまずの結果だと思います.
次回はこれをさらに高速化させていければよいと思います.
